🌊 Flood Mapping of Godavari 2025
Overview
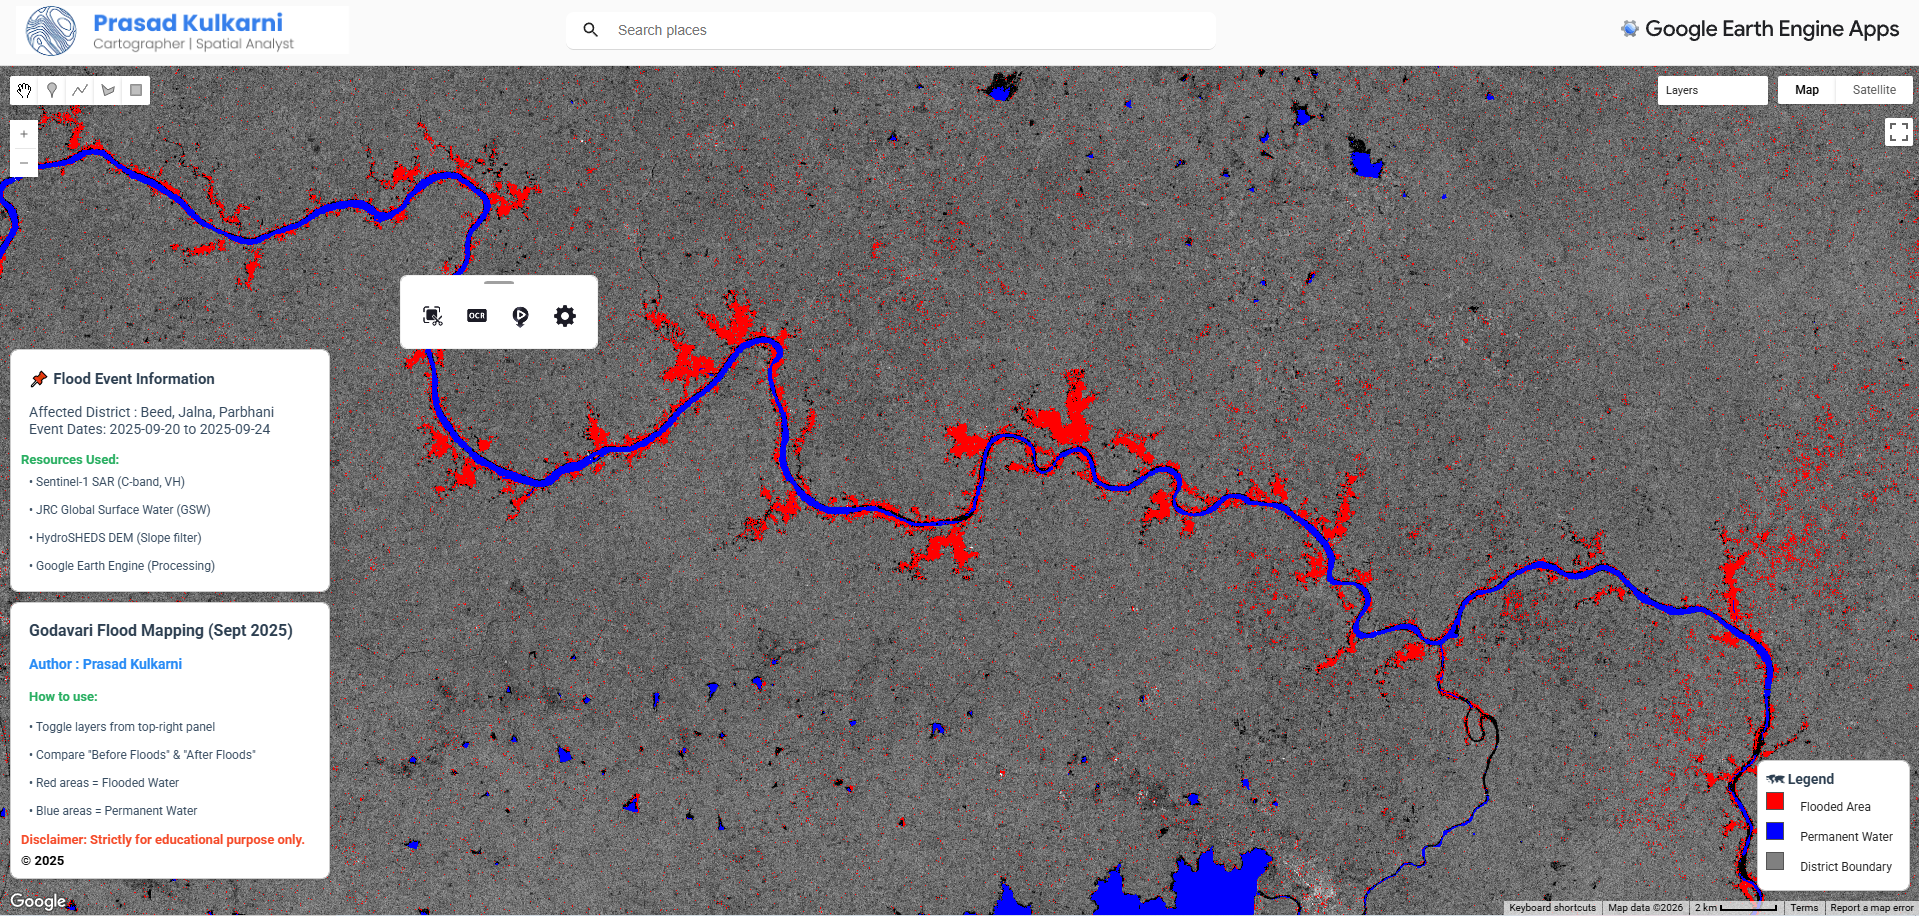
This project utilizes satellite remote sensing to map and analyze the severe flooding events in the Godavari River basin during 2025. By leveraging cloud-based geospatial processing, the application provides an interactive visualization of the flood extent, allowing for rapid assessment of affected areas to aid in disaster response and mitigation planning.
Study Area: Middle Godavari Basin
Duration: 2025-09-20 to 2025-09-24
Role: Solo project
Status: Completed
Methods & Tools
Data Sources
- Sentinel-1 SAR (C-band, VH)
- JRC Global Surface Water (GSW)
- HydroSHEDS DEM (Slope filter)
Processing Steps
- Data Selection & Temporal Filtering: The script filters Sentinel-1 imagery into two distinct timeframes: Before Floods: September 6, 2025 – September 20, 2025 After Floods: September 24, 2025 – October 1, 2025
- Mosaicking & Clipping: The filtered image collections are mosaicked into single, seamless baseline and crisis images, which are then clipped to the boundaries of the Beed, Jalna, and Parbhani districts.
- Speckle Filtering (Refined Lee Filter): Because raw radar imagery suffers from "speckle" (a salt-and-pepper noise effect), a custom Refined Lee Speckle Filter is applied to both the before and after images. The script temporarily converts the data from decibels (dB) to natural units, applies the 7x7 spatial filter to smooth the noise while preserving edges, and converts it back to dB.
- Change Detection & Thresholding: The script divides the filtered "after" image by the "before" image. A threshold ratio of 1.25 is applied. Pixels exceeding this difference indicate a significant drop in radar backscatter, signifying newly accumulated water.
- Data Refinement & Masking: To ensure high accuracy and remove false positives, three masks are applied to the initial flood layer:Permanent Water Mask: Areas identified by the JRC dataset as having high water seasonality (score $\ge$ 5) are removed, ensuring the map only shows new flooding.Terrain/Slope Mask: Using the HydroSHEDS DEM, areas with a slope greater than 5% are masked out to eliminate radar shadows in valleys.Isolated Pixel Removal: A connected-pixel threshold is applied to remove tiny, disconnected "puddles" (clusters smaller than 8 pixels), cleaning up the final output.
- Area Calculation: The final refined flood layer is multiplied by the pixel area (ee.Image.pixelArea()). A reducer sums these values across the geometry, converting the final statistic into hectares for reporting.
Tools Used
| Tool | Purpose |
|---|---|
| GEE | Platform & Environment |
| GEE User Interface (ui) API | Used to build the interactive front-end elements |
| Sentinel-1 SAR (Synthetic Aperture Radar) | The core dataset used for flood mapping |
Key Findings
- Total Inundated Area: The analysis revealed the land were submerged during the peak of the 2025 flood event.
- Most Affected Regions: The districts/regions of Jalna, Beed, Parbhani, NAnded experienced the highest concentration of flooding, particularly along the lower banks of the Godavari River.
- Temporal Dynamics: The flood extent peaked around 22-23 Sept 2025